
Power BI

Production Dashboards in Power BI

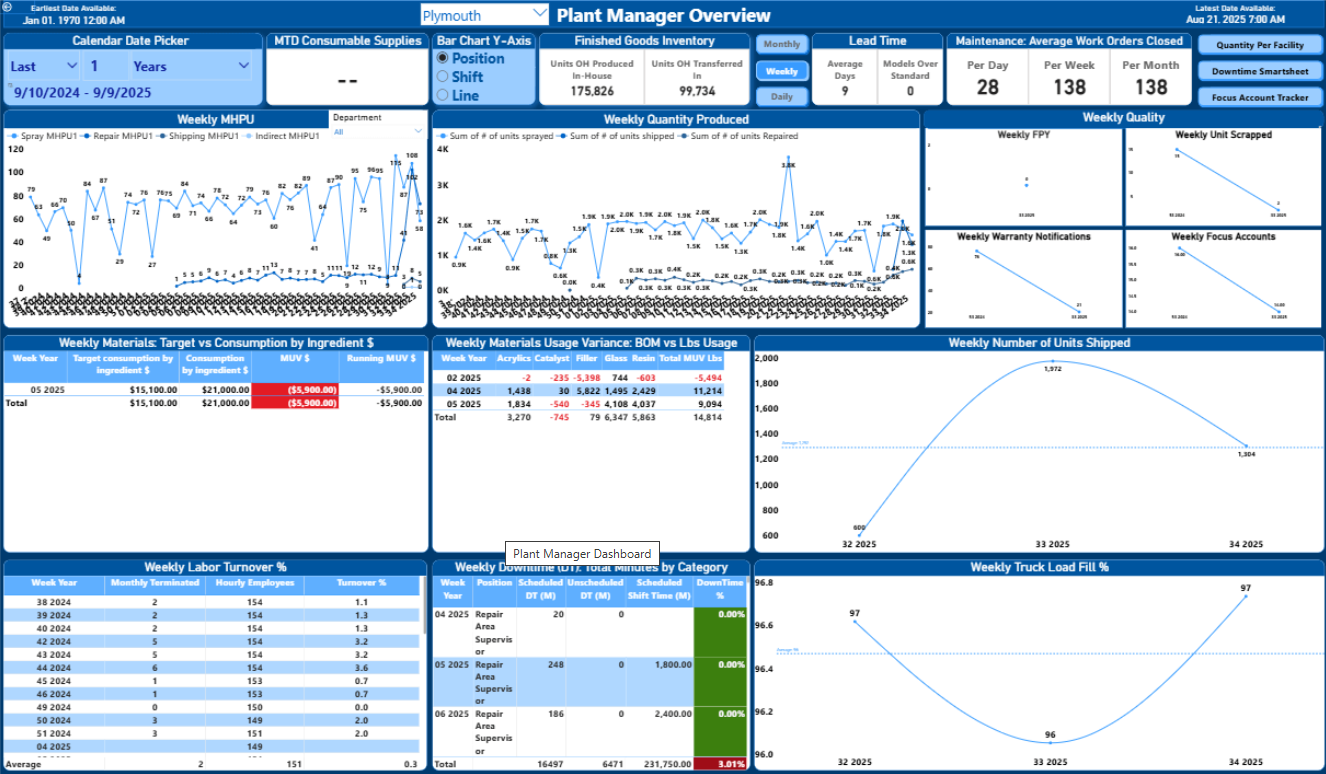
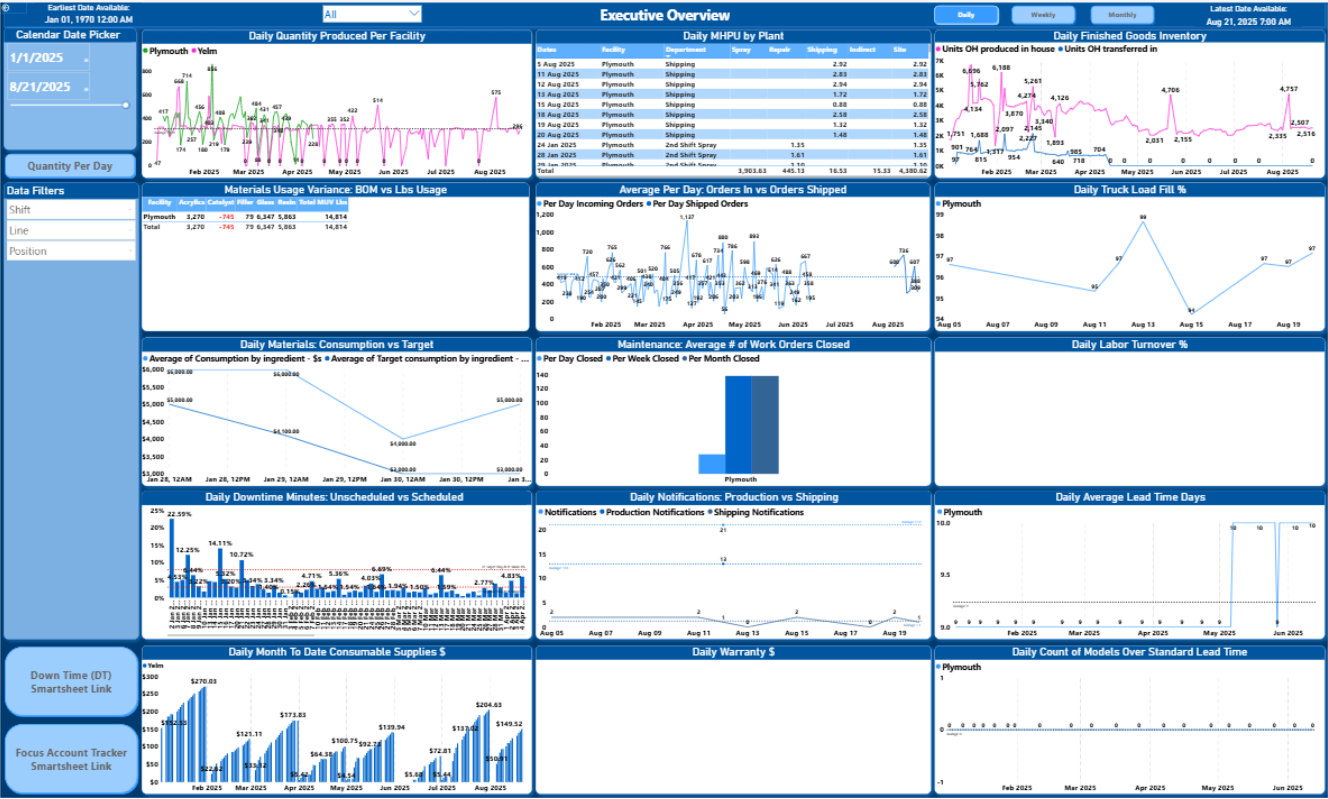
We built Power BI dashboards for American Bath Group that give plant managers and executives one place to follow manufacturing performance, from units produced and shipped to quality, materials usage, downtime and lead time.

Client
American Bath Group
Location
USA
Technology
  • Power BI

What we built

Key features and contributions

Key features

  • Plant Manager Overview for a selected facility
  • Executive Overview across facilities
  • Daily, weekly and monthly views
  • Date range, shift, line and position filters
  • Quantity produced, shipped and repaired
  • Man-hours per unit by department
  • Quality, scrap and warranty notification trends
  • Materials usage variance and consumption against target
  • Finished goods inventory and lead time
  • Scheduled and unscheduled downtime
  • Labor turnover and truck load fill
  • Maintenance work orders closed

Business outcome

The dashboards put the measures that plant managers and executives follow in one place, so production performance can be reviewed by day, week or month without assembling reports by hand.

View all projects

Model-Driven App Digital Edge, Singapore

NRC Decision Flow: Decision & Approval Management System

A model-driven Power App that takes business decisions through staged reviews and approvals, with role-based security, SharePoint documents and Power BI reporting.

  • Model-Driven Power Apps
  • Dataverse
  • Power Automate
  • SharePoint
  • Microsoft Entra ID

Canvas App IAME, United Kingdom

Identity Management Application

A canvas app that manages the creation and lifecycle of service, contractor and payroll accounts, with approvals and automated provisioning into Microsoft Entra ID.

  • Power Apps Canvas
  • Dataverse
  • SharePoint
  • Power Automate
  • Microsoft Entra ID
  • Azure Automation