ABG Production Dashboards V2

Overview
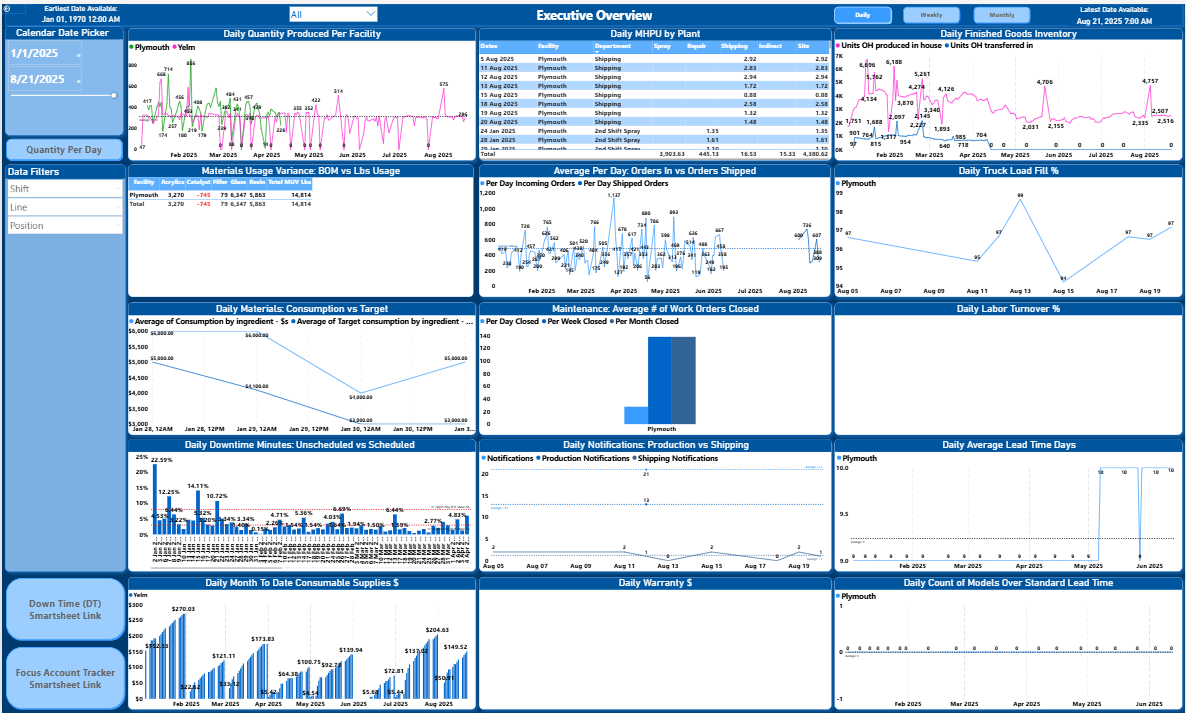
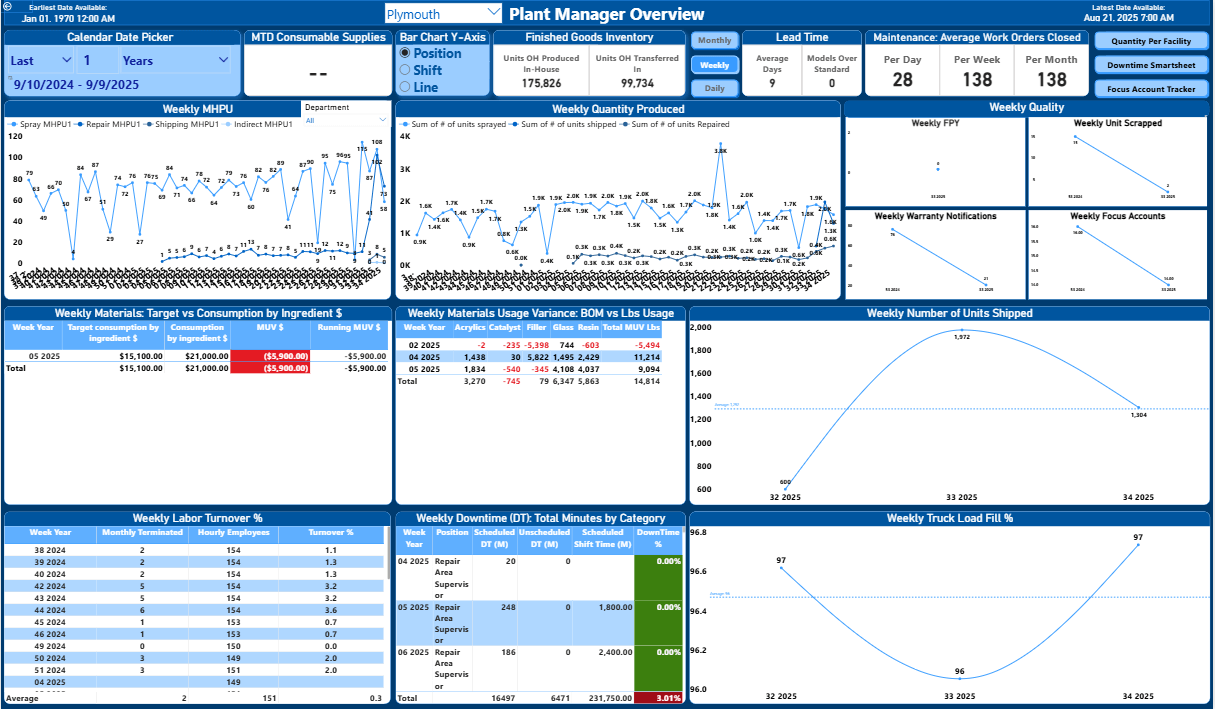
In this project, I developed ABG Production Dashboards V2, a comprehensive Power BI reporting solution designed to monitor and analyze production data across different organizational levels. The data is sourced from the Rowdatapoint table, ensuring real-time insights into production performance and trends. The solution consists of two tailored dashboards: Plant Manager Dashboard and Executive Dashboard, each catering to distinct user requirements while providing a seamless, interactive experience.
Data Integration:
The production data is collected, cleaned, and structured from the Rowdatapoint table, enabling efficient reporting without manual data preparation. The dataflow ensures automated updates, allowing decision-makers to access the latest information at any time.
Plant Manager Dashboard:
The Plant Manager Dashboard is designed to help operational managers track daily, weekly, and monthly production activities in detail. Key features include:
- Table Visuals: Present raw and aggregated data in tabular form for quick review and analysis.
- Line Graphs: Visualize production trends over time to help managers monitor performance and identify anomalies.

Interactive Filters:
- Daily, Weekly, Monthly Buttons: Allow users to view data at different time intervals for targeted analysis.
- Calendar Date Picker: Provides the flexibility to filter data for custom date ranges, offering granular control over the reporting period.
This dashboard enables plant managers to stay informed about production output, capacity utilization, and efficiency, helping them take timely actions to optimize operations.
Executive Dashboard:
The Executive Dashboard is built for leadership teams, focusing on high-level trends and strategic decision-making. It includes:
- Line Graphs: Display key performance metrics over time, helping executives identify growth patterns and potential concerns.
- Table Visuals: Provide supporting details for deeper insights, allowing users to drill down into specific areas as needed.

Interactive Filters:
- Daily, Weekly, Monthly Buttons: Quickly switch between different reporting intervals to track short-term and long-term trends.
- Calendar Date Picker: Allows precise date selection to tailor reports to executive review cycles or specific periods of interest.
The Executive Dashboard offers a visually intuitive overview of production performance, ensuring that leadership has a clear understanding of operations to guide strategic planning.
Business Impact:
The ABG Production Dashboards V2 project has brought significant improvements to how production data is monitored and utilized:
- Improved Accessibility: Automated dataflows ensure up-to-date reporting without manual intervention.
- Operational Efficiency: Managers can quickly identify issues and trends, improving response times and operational effectiveness.
- Strategic Insights: Executives have access to high-level metrics and trends, empowering data-driven decision-making.
- User-Friendly Experience: Interactive filters and dynamic visuals ensure that users can explore data based on their unique needs.
This Power BI solution demonstrates my expertise in creating tailored dashboards that serve both operational and strategic users. Through interactive visuals, automated dataflows, and insightful reporting, the ABG Production Dashboards V2 has enabled better monitoring, informed decision-making, and enhanced productivity across the organization.
Contact Information:
- Email: info@voxtus.com
- Phone:+91-8630235507
Project information
Category: Power BI Dashboard Design
Client: American Bath Group
Project date: 29 August, 2025
Information Technology:
- Power BI
- Microsoft Dataverse
