Identity Management Overview Dashboard

Overview
In this project, I developed a sophisticated Overview Dashboard using Power BI for Identity Management, aimed at providing actionable insights into user accounts, identities, and applications. The dashboard integrates data from various sources to give security teams, administrators, and stakeholders a clear and comprehensive view of account activities, risks, and certifications.

Data Integration and Management:
The data is sourced from multiple IAM systems to track account statuses, identities, application usage, access requests, and certifications. The structured data is processed and visualized in Power BI, offering a real-time snapshot of the organization's security posture. Automated refreshes ensure that the data is always current and reliable.
Dashboard Highlights:
The dashboard is designed with usability and clarity in mind, providing quick access to key metrics and trends:
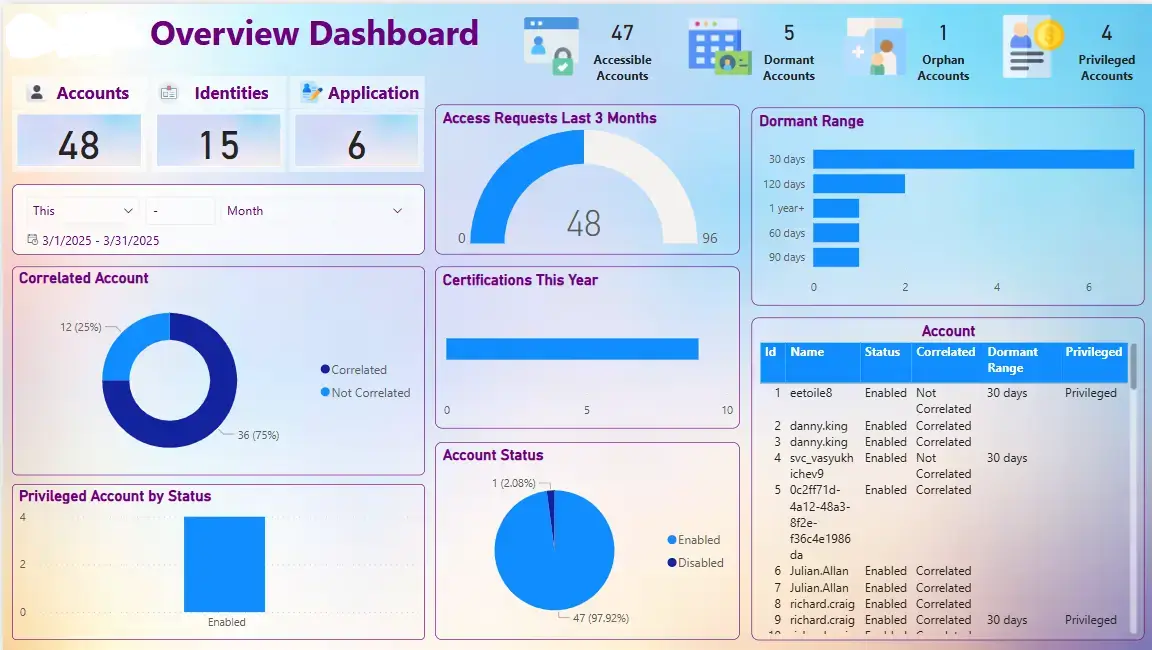
- Accounts, Identities, and Applications Summary
Displays high-level counts, helping users quickly assess the overall environment, including total accounts, identities, and application access points. - Account Health Metrics
- Accessible Accounts: Highlights the number of accounts actively accessible within the system.
- Dormant Accounts: Displays accounts with no activity over a specific period, helping identify unused or abandoned accounts.
- Orphan Accounts: Tracks accounts without associated owners, which can pose security risks.
- Privileged Accounts: Highlights high-risk accounts with elevated access permissions.
- Access Requests in the Last 3 Months
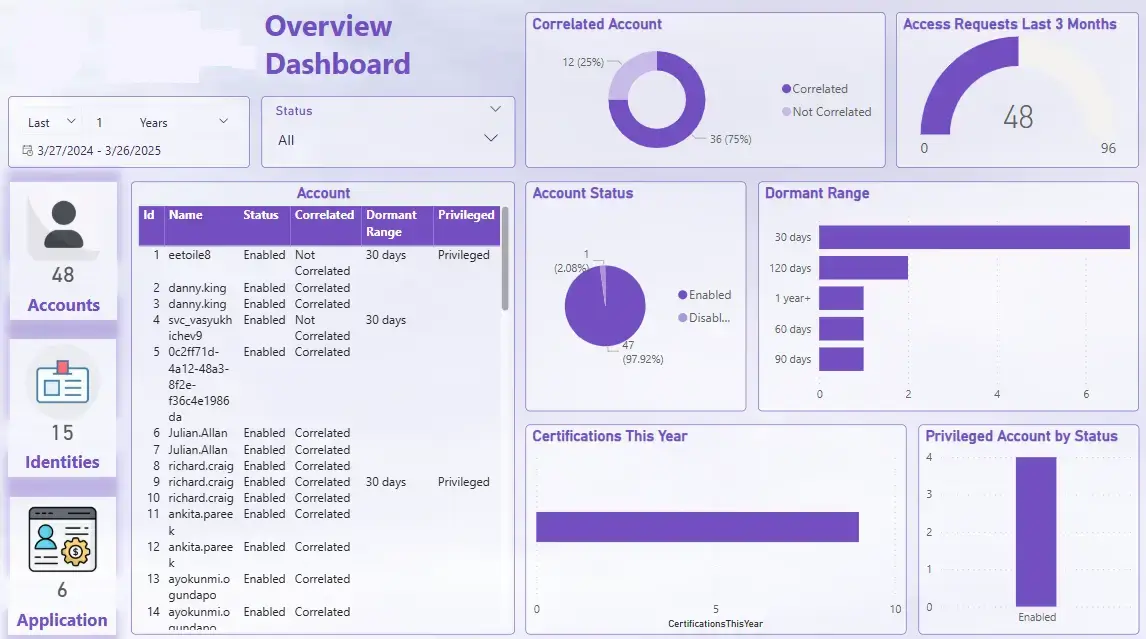
A gauge visualization showing the total number of access requests, helping teams monitor usage trends and request patterns. - Correlated vs Not Correlated Accounts
A pie chart visualization helps distinguish accounts linked to identities versus those without proper correlation, which is vital for audits and compliance. - Certifications This Year
Provides a quick view of certification activities, allowing teams to track compliance and ensure that access controls meet required standards. - Dormant Range Analysis
A bar chart categorizing dormant accounts by inactivity periods (30 days, 120 days, etc.), helping identify accounts that need review or deactivation. - Privileged Account by Status
Tracks the operational state of privileged accounts to ensure proper monitoring and security management. - Account Status Overview
Displays the percentage of enabled versus disabled accounts, providing a snapshot of account health and access management. - Detailed Account List
A comprehensive table listing accounts by ID, name, status, correlation state, dormant range, and privileged access status, allowing teams to investigate specific accounts quickly.

Interactive Features:
- Date Filters: Users can select specific timeframes to narrow down reports.
- Dynamic Visualizations: Charts and tables automatically update based on selected filters, providing tailored insights.
- User-Friendly Layout: Designed to present critical information at a glance, ensuring that both technical and non-technical users can access the insights they need.
Business Impact:
The Identity Management Overview Dashboard has empowered security teams and management to:
- Monitor access trends and dormant accounts proactively.
- Identify high-risk accounts such as orphans and privileged accounts.
- Improve audit readiness by tracking certifications and correlated identities.
- Enhance operational efficiency with real-time data and intuitive visualizations.
This solution demonstrates my expertise in leveraging Power BI to provide security-focused analytics, support data-driven decision-making, and streamline identity and access management processes within organizations.
Contact Information:
- Email: info@voxtus.com
- Phone:+91-8630235507
Project information
Category: Power BI Dashboard Design
Project date: 29 March, 2025
Information Technology:
- Power BI
- Microsoft Dataverse
